環境: macOS Sierra 10.12.5, CPU: 3.3 GHz Intel Core i5, メモリ: 8 GB. Python 3.5.3, DeepChem 1.1.0, TensorFlow 1.0.1, RDKit 2017.03.3.
参考サイト: Graph convolution regression with deepchem – Is life worth living?
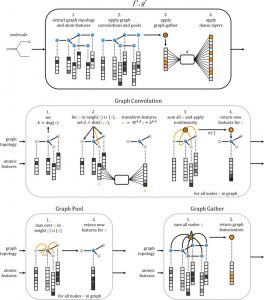
DeepChemは化合物のグラフ構造に対して畳み込み演算 (Graph convolution) を行うための機械学習ライブラリです.化合物のGraph convolutionについては,Altae-Tran et al., (2017) のfigure (右図, Copyright © 2017 American Chemical Society) がパッと分かりやすい気がします (Altae-Tran, H., et al. ACS Cent. Sci. 2017, 3, 283. doi: 10.1021/acscentsci.6b00367).
では,参考サイトの見様見真似でやってみます.
Installing DeepChem on macOS Sierra
OSは64bit Linuxしかサポートしていないそうですが,macOSにインストールしてみます.Condaを利用した方法が簡単そうなのでこれを採用しました (https://github.com/deepchem/deepchem).
(anaconda3-4.4.0)$ git clone https://github.com/deepchem/deepchem.git
(anaconda3-4.4.0)$ cd deepchem
scripts/install_deepchem_conda.shの
if [ "$python_version" == "3.5" ]
then
    export protobuf_url=https://storage.googleapis.com/tensorflow/linux/cpu/protobuf-3.1.0-cp35-none-linux_x86_64.whl
else
    export protobuf_url=https://storage.googleapis.com/tensorflow/linux/cpu/protobuf-3.1.0-cp27-none-linux_x86_64.whl
fi
の部分を
if [ "$python_version" == "3.5" ]
then
    export protobuf_url=https://storage.googleapis.com/tensorflow/mac/cpu/protobuf-3.1.0-cp35-none-macosx_10_11_x86_64
else
    export protobuf_url=https://storage.googleapis.com/tensorflow/mac/cpu/protobuf-3.1.0-cp27-none-macosx_10_11_x86_64
fi
に書き換えます.
(anaconda3-4.4.0)$ bash scripts/install_deepchem_conda.sh deepchem
(anaconda3-4.4.0)$ source activate deepchem
TensorFlowは1.0.1がインストールされました.これは拡張命令がサポートされていないと表示が出るので前回と同じようにビルドします (適当なディレクトリに移動).
(anaconda3-4.4.0/envs/deepchem)$ git clone https://github.com/tensorflow/tensorflow
(anaconda3-4.4.0/envs/deepchem)$ cd tensorflow
(anaconda3-4.4.0/envs/deepchem)$ git checkout r1.0
(anaconda3-4.4.0/envs/deepchem)$ ./configure
以下の質問は個別に答えて,残りはreturnを押す.
Do you wish to use jemalloc as the malloc implementation? (Linux only) [Y/n] n
---
Please input the desired Python library path to use.  Default is ...
/PATHTO/.pyenv/versions/anaconda3-4.4.0/envs/deepchem/lib/python3.5/site-packages
(anaconda3-4.4.0/envs/deepchem)$ bazel build --config=opt //tensorflow/tools/pip_package:build_pip_package
(anaconda3-4.4.0/envs/deepchem)$ bazel-bin/tensorflow/tools/pip_package/build_pip_package /tmp/tensorflow_pkg
(anaconda3-4.4.0/envs/deepchem)$ pip uninstall tensorflow
(anaconda3-4.4.0/envs/deepchem)$ pip install /tmp/tensorflow_pkg/tensorflow-1.0.1-cp35-cp35m-macosx_10_7_x86_64.whl
deepchemディレクトリに戻って,
(anaconda3-4.4.0/envs/deepchem)$ python setup.py install
(anaconda3-4.4.0/envs/deepchem)$ conda install jupyter matplotlib
DeepChemを使ってみる
SDFファイルを変換して,以下のようにSMILES表記と溶解度が記載されたCSVファイル (solubility.csv) を作ります.
name,smiles,solubility
60-35-5,CC(N)=O,1.58
60-34-4,CNN,1.34
64-19-7,CC(O)=O,1.22
新しくディレクトリを作ってファイルを移動させます.
(anaconda3-4.4.0/envs/deepchem)$ mkdir NEWDIR
(anaconda3-4.4.0/envs/deepchem)$ mv solubility.csv NEWDIR/
(anaconda3-4.4.0/envs/deepchem)$ cd NEWDIR
(anaconda3-4.4.0/envs/deepchem)$ ipython
参考サイトGraph convolution regression with deepchem – Is life worth living?を真似てみます.
#モジュールの読み込み
import tensorflow as tf
import deepchem as dc
import numpy as np

graph_featurizer = dc.feat.graph_features.ConvMolFeaturizer()
loader = dc.data.data_loader.CSVLoader( tasks = ['solubility'], smiles_field = "smiles", id_field = "name", featurizer = graph_featurizer )
dataset = loader.featurize( './solubility.csv' )
Loading raw samples now.
shard_size: 8192
About to start loading CSV from ./solubility.csv
Loading shard 1 of size 8192.
Featurizing sample 0
Featurizing sample 1000
TIMING: featurizing shard 0 took 1.425 s
TIMING: dataset construction took 1.869 s
Loading dataset from disk.
splitter = dc.splits.splitters.RandomSplitter()
trainset, testset = splitter.train_test_split( dataset )

hp = dc.molnet.preset_hyper_parameters
param = hp.hps[ 'graphconvreg' ]
print( param )

#
#n_atoms = 5
n_feat = 75
batch_size = 32

graph_model = dc.nn.SequentialGraph( n_feat )

graph_model.add( dc.nn.GraphConv( int( param[ 'n_filters' ]), n_feat, activation = 'relu' ) )
graph_model.add( dc.nn.BatchNormalization( epsilon = 1e-5, mode = 1 ) )
graph_model.add( dc.nn.GraphPool() )

## Gather Projection
#graph_model.add( dc.nn.Dense( int( param[ 'n_fully_connected_nodes' ] ),  int( param[ 'n_filters' ] ), activation = 'relu' ) )
graph_model.add( dc.nn.BatchNormalization( epsilon = 1e-5, mode = 1 ) )
graph_model.add( dc.nn.GraphGather( batch_size, activation = "linear" ) )
Kerasみたいな書き方ですね.
with tf.Session() as sess:
    model_graphconv = dc.models.MultitaskGraphRegressor( graph_model,
    1,
    n_feat,
    batch_size = batch_size,
    learning_rate = param[ 'learning_rate' ],
    optimizer_type = 'adam',
    beta1 = .9, beta2 = .999 )
    model_graphconv.fit( trainset, nb_epoch = 10 )
Starting epoch 9
On batch 0
On batch 50
On batch 100
On batch 150
On batch 200
On batch 250
On batch 300
test_scores = {}
train_scores = {}
regression_metric = dc.metrics.Metric( dc.metrics.mean_squared_error )
test_scores[ 'graphconvreg' ] = model_graphconv.evaluate( testset, [ regression_metric ]  )
train_scores[ 'graphconvreg' ] = model_graphconv.evaluate( trainset, [ regression_metric ]  )
computed_metrics: [0.66776533011426364]
computed_metrics: [0.44895978015740012]
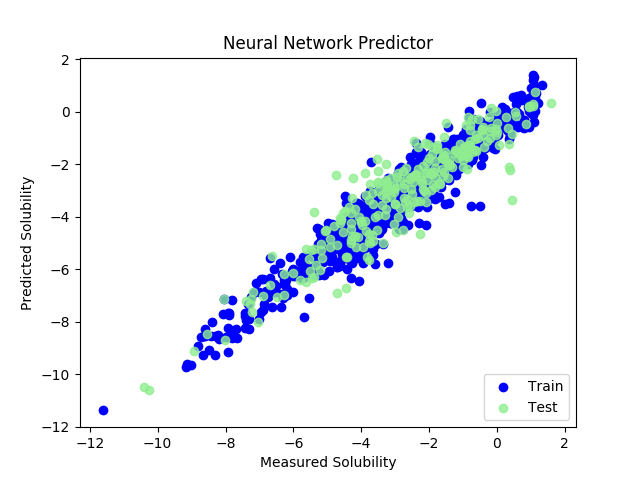
RMSはRDkitのdescriptorを使った場合と同等でした.
pred_train = model_graphconv.predict( trainset )
pred_test = model_graphconv.predict( testset )

y_train = np.array( trainset.y, dtype = np.float32 )
y_test = np.array( testset.y, dtype = np.float32 )
pred_train = np.array( pred_train, dtype=np.float32 )
pred_test = np.array( pred_test, dtype=np.float32)

import matplotlib.pyplot as plt

plt.figure()
plt.scatter( y_train, pred_train, label = 'Train', c = 'blue' )
plt.title( 'Neural Network Predictor' )
plt.xlabel( 'Measured Solubility' )
plt.ylabel( 'Predicted Solubility' )
plt.scatter( y_test, pred_test, c = 'lightgreen', label = 'Test', alpha = 0.8 )
plt.legend( loc = 4 )
plt.show()
(了)